
A layout that fits
Give a chart more room, move a summary to the top, or add a tile from the catalog.
Track your results, understand your trading habits, and find something to work on. Start with the built-in dashboards, then arrange them around your own review routine.
Add, move, and resize tiles. Each dashboard keeps its own filters and layout, so you can set up separate views for different accounts or review routines.
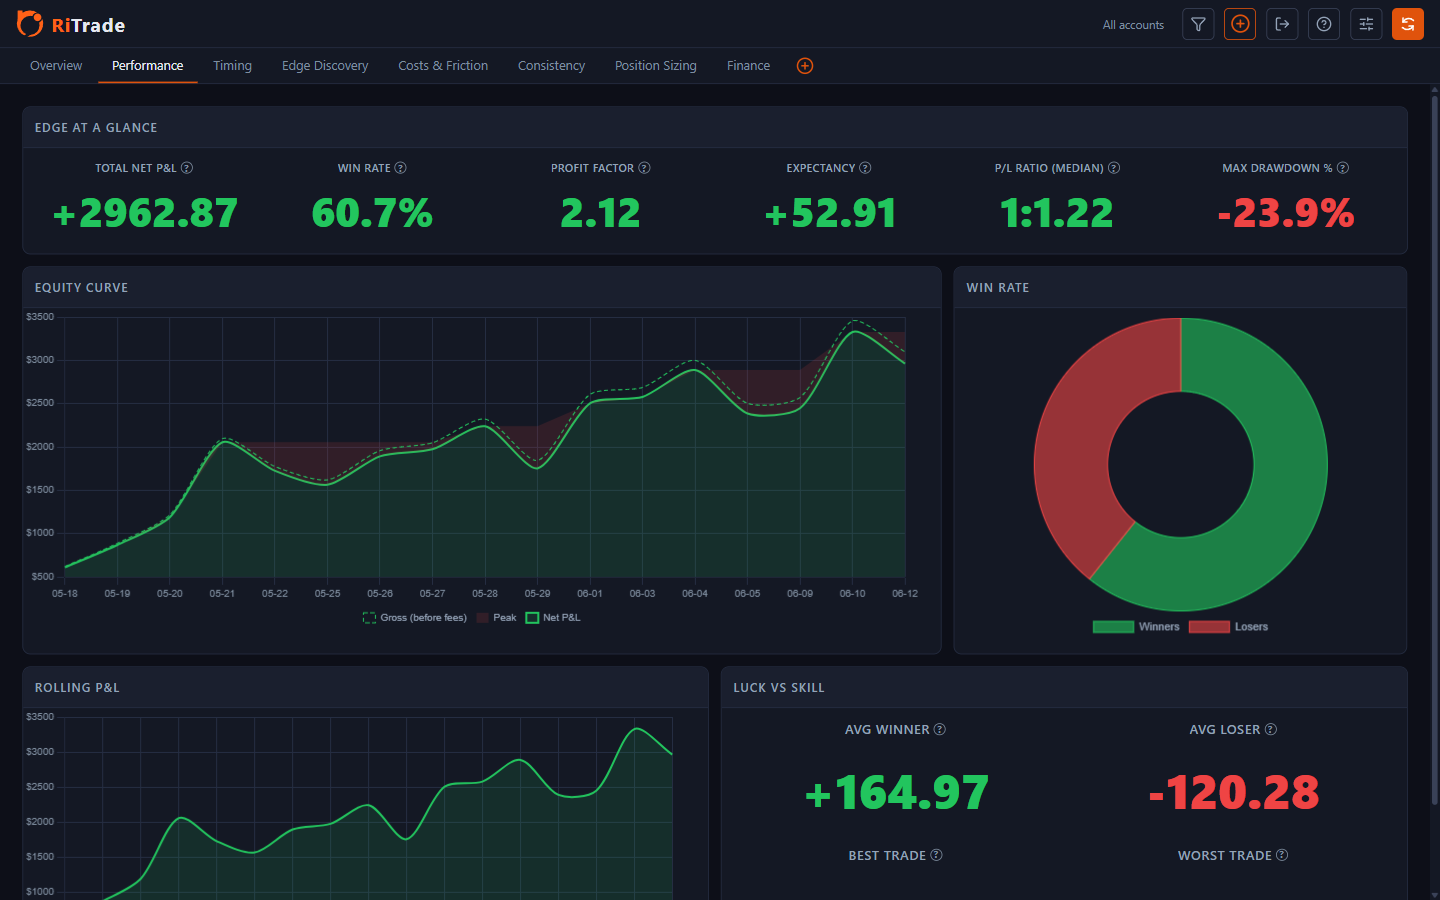
Give a chart more room, move a summary to the top, or add a tile from the catalog.
Adjust tile text sizes and choose a light or dark theme.
Keep the filters, timezone, and arrangement you need for that view.
Read your net P&L alongside win rate, average trade, and drawdown. Use the account, symbol, and date filters to narrow the view.
See which instruments contributed to your results over the period you select.
Review patterns by hour and day, alongside how long you held your trades.
Check the trade count when reading a metric. A short winning run can look very different over a longer period.
Compare gross and net P&L to see how commissions and fees affect your results. Use the Finance ledger to track deposits, withdrawals, subscriptions, dividends, and taxes separately.
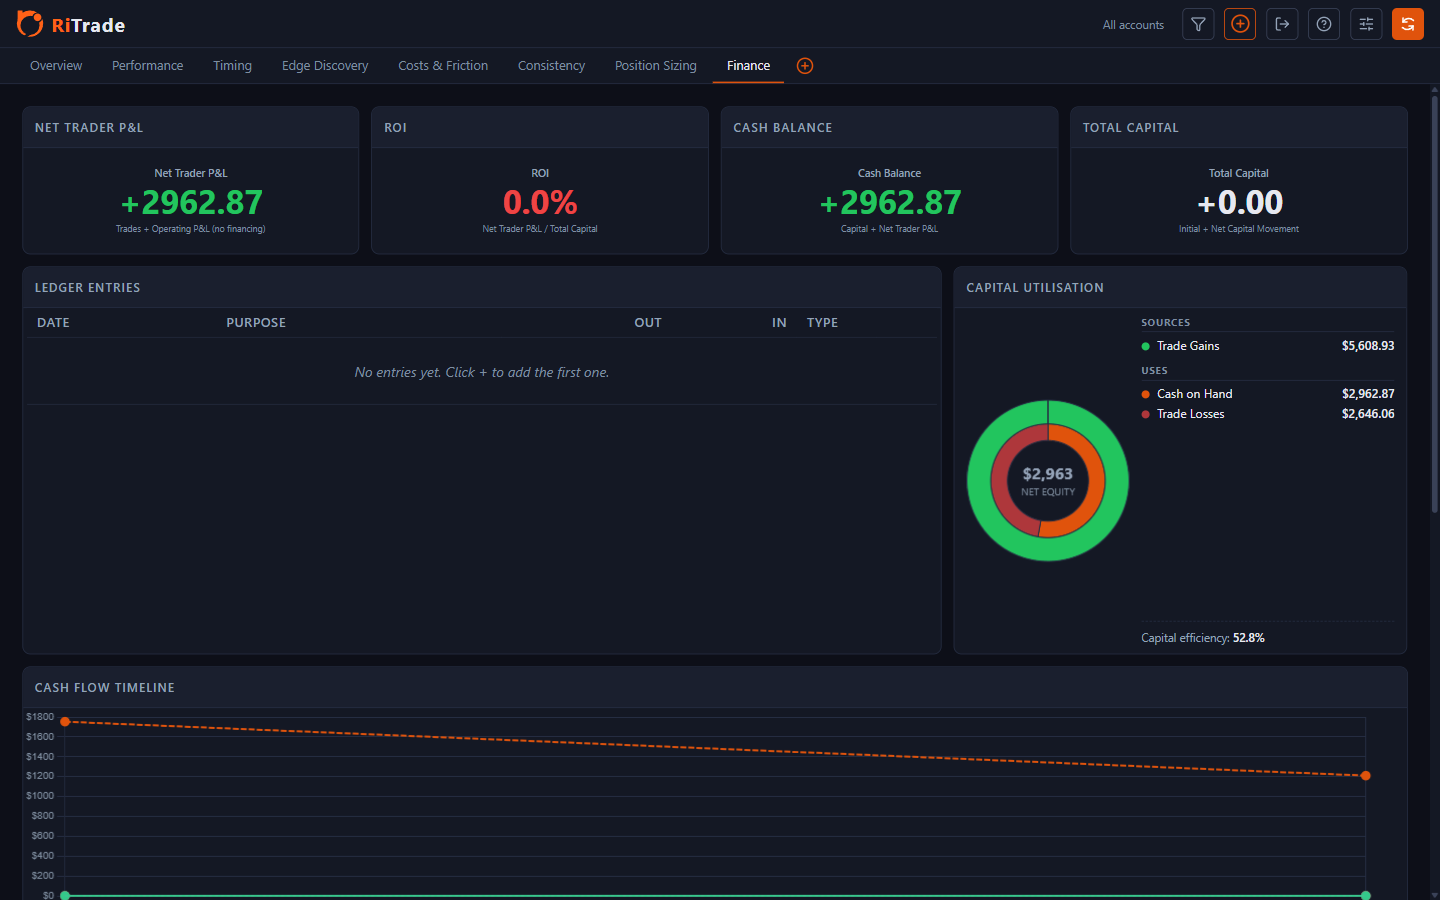
Review cash movements alongside trading results. Deposits and withdrawals are not trading profits or losses.
RiTrade detects supported formats and shows a preview. For other compatible CSVs, map the columns and save a template to use next time.
See brokers and formats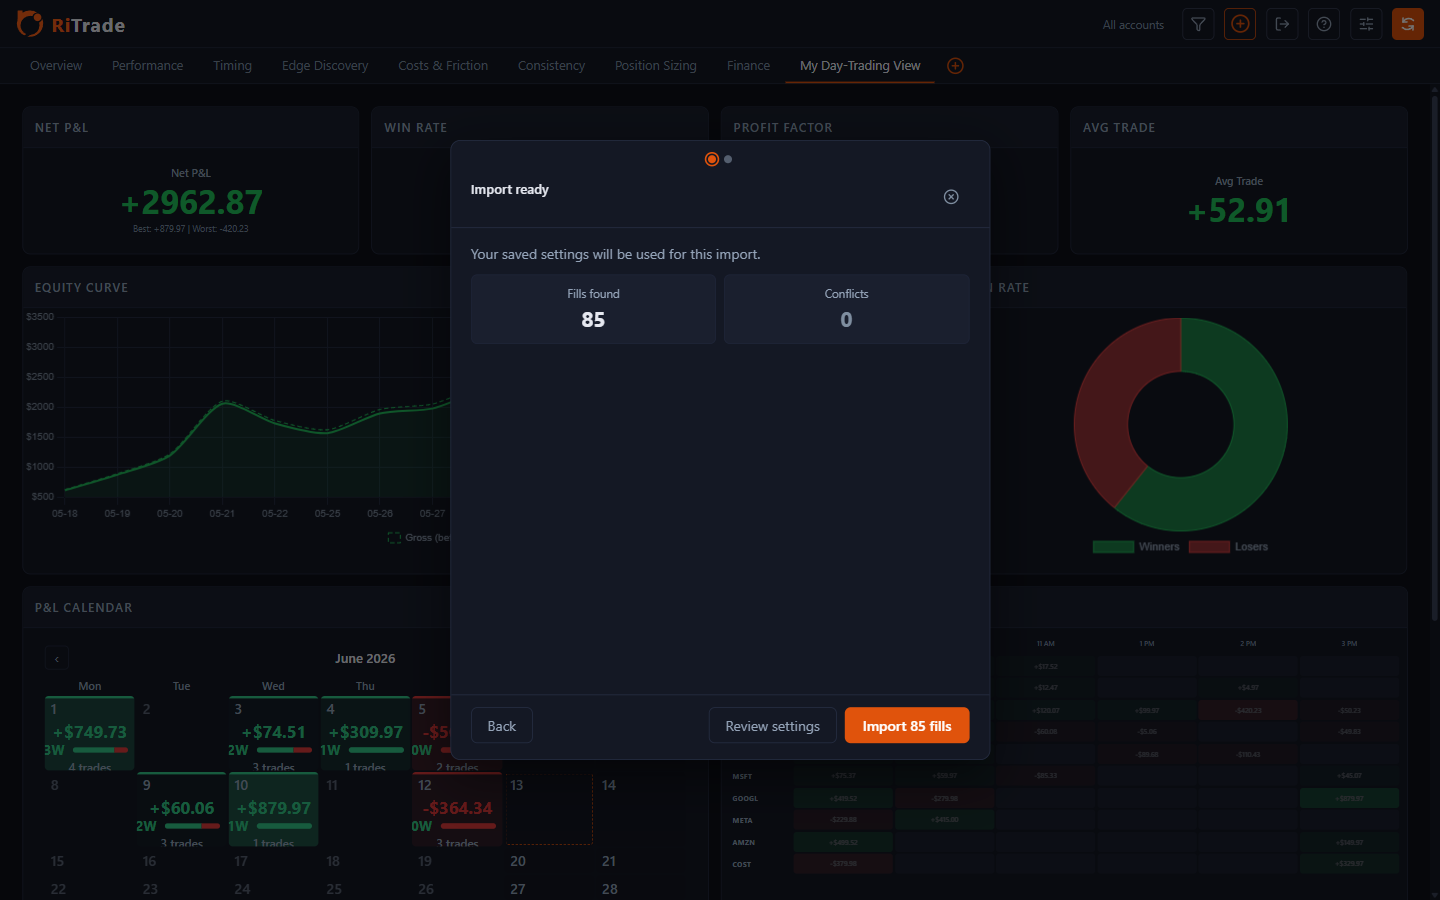
Export a supported file from your broker, then open it in RiTrade.
Check the detected format and rows. Resolve any import errors before saving.
Confirm the import, then filter your results by account, symbol, or date.
Bring in your trades and see where you can improve.